Forecasting COVID-19: New UMD Research Could Help
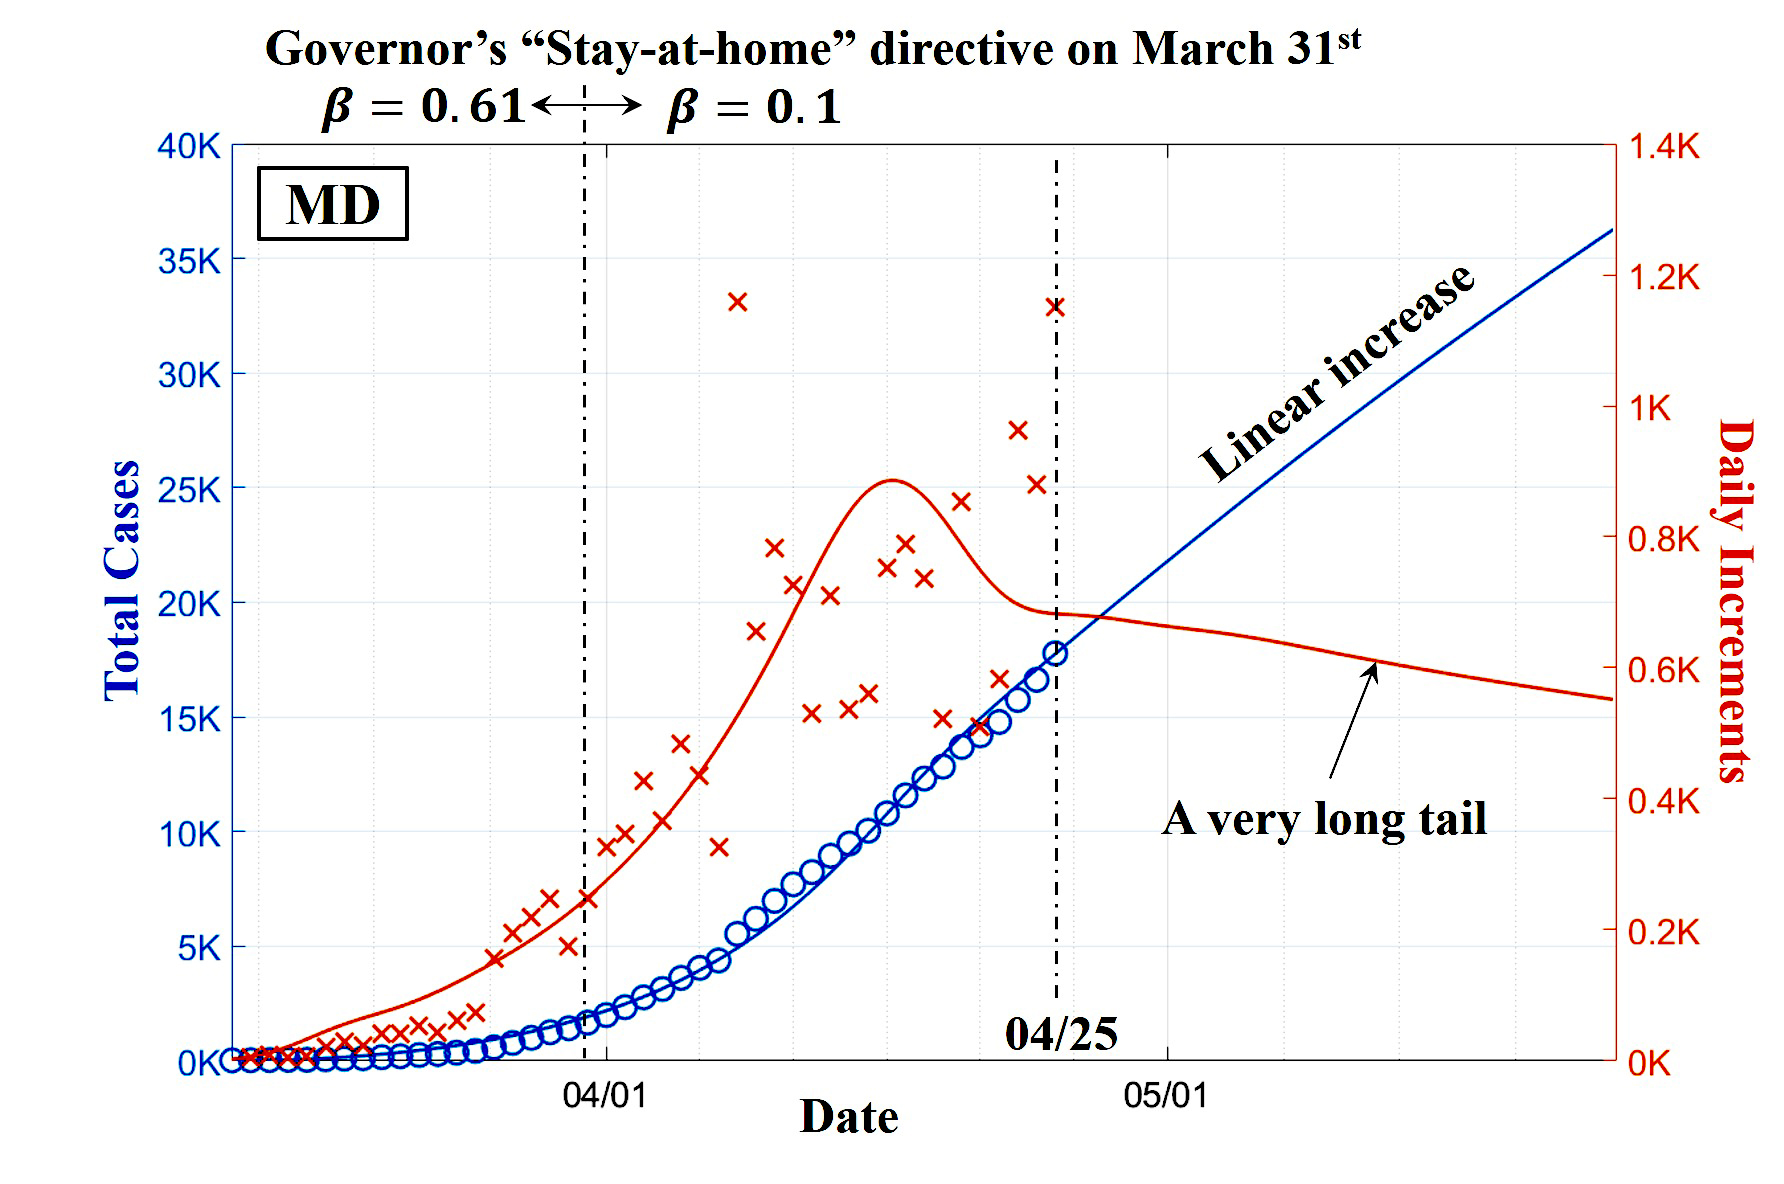
Balachandran and his collaborators on the study, UMD postdoctoral researcher Xianbo Liu and PhD candidate Xie Zheng, are using well-established models—including the Logistic Model, widely used for modeling population trends, and the Generalized Logistic Function Model, developed in 1959 to assist in studying plant growth—to project trends based on the data available so far. “These models are not new,” Balachandran said, “but the application to this particular problem is.” So far, actual COVID-19 trends align closely with the results produced by the models, with the peaks occurring as predicted, and the case counts following the model’s curve. Because of their approach’s success in modeling the actual outcomes so far, Balachandran and his team are hopeful that it can deliver reliable forecasts.
Apart from statistical models based on the Generalized Logistic Function, Balachandran and his group have developed an original, extended compartmental model with time delays and other features to study the COVID-19 dynamics. The team is using this model to answer a crucial question. How long or short is the “tail,” or downward slope, that follows a peak in the plot of daily infection increments versus time. For several countries, including China and South Korea, the tail has been a short one, with the number of new infections rapidly dropping off after the peak was reached. But other countries have fared less well. For instance, in Italy, the rate of infection spiked in late March, but the peak has been followed by a long “tail,” with the number of new infections not showing a rapid decrease over several months. In some U.S. states, including Maryland, the dynamics are similar to that of Italy, but more data is needed to make more robust forecasts, Balachandran said. “As of now, it looks like we are seeing a long tail,” he said. “But we’ll need more numbers past the peak in order to make projections with higher level of confidence.” In general, he said, the models show that steps taken to flatten the curve, particularly quarantining and widespread testing, are effective—and the stricter the measures, the shorter the tail. “Those countries which imposed strict measures early on were able to bring the infection rate down relatively quickly,” he said. “Others are still seeing significant daily increases in the number of cases, well past the peak.” Balachandran’s project is one of several being undertaken in response to the COVID-19 by engineers at the A. James Clark School of Engineering, of which the mechanical engineering department is a part.
Related Articles: April 29, 2020 Prev Next |
|


 A new study led by
  “Based on the data we have available, we want to be able to identify a model that can be used to predict the dynamics of COVID-19 going forward,” Balachandran said. “This is an example of data-driven dynamics.” He has been studying data-driven dynamics in the context of other dynamics, including chaotic dynamics and rapid transitions such as extreme waves.